How to Sign in to Amazon Quick Suite


To sign in to QuickSight,

  1. Go to https://quicksight.aws.amazon.com/ (ref. Figure-1) & setup a new password if you are a new user.
  2. For QuickSight account name, enter your account name i.e. vertexgroup. This is the name that was created when the QuickSight account was created in AWS. If you are invited to the QuickSight account by email (ref. Figure-2), you can also find the account name inside of that email. If you don't have the email that invited you to QuickSight, ask the QuickSight administrator in your organization for the information that you need
  1. Click Next. For Username, enter your QuickSight username. Usually that is your Vertex email address. The page will appear below. (ref. Figure-3)
  1. For Password, enter your password
       Passwords are case-sensitive and must be 8–64 characters in length.
       They must also contain each of the following:
       • Lowercase letters (a–z)
       • Uppercase letters (A–Z)
       • Numbers (0–9)
       • Nonalphanumeric characters (~!@#$%^&*_-+=`|\(){}[]:;"'<>,.?/)
  2. Click Sign In. Now you will be able to see the below (reff. Figure-4) dashboard page.

Use the following procedure to sign in to QuickSight.

Quick Start

  1. You will now see a screen displaying the dashboard interface.Locate the dashboard as shown in the highlighted section and click on it to view the datasets. (ref Figure-5)
  1. Upon clicking the dashboard, you will be directed to a screen displaying various data sections such as Customer Profiles, Quotes Details, Sales Orders, Invoices, Returns, vendor profiles, Purchase Order & Bill details etc . To view specific details, simply click on the relevant record type to access the associated data (ref. Figure-6)
  1. Icons under the top right corner are as follows. (ref. Figure-7)
  1. Scheduling: (For only Admins/Author Roles)
    To schedule and send an email with specific data, click on the Schedule icon.
    From there, you can configure the settings to:
        • Choose the data you want to include
        • Set the time and frequency for the email
        • Specify the recipients
  2. Bookmarks:

    To add specific data to the dashboard, click on the Bookmark icon.Then, assign a unique name to the bookmark. Once saved, it will appear in the dashboard for easy access and reference.
  3. Export:

    To print or export the data, click on the Export icon.
  4. Data:

    To view the different datasets used in the current visual data, click on the Data icon.
    This will display a list of datasets included in the current view. For example, if the dashboard is showing Customer data, clicking the Data icon will reveal:
       • The datasets directly related to Customers
       • Any other datasets that were combined or joined to create the Customer view

    This helps you understand the data sources behind the visuals and how they’re connected.
  5. Share:

    To share the data view, click on the Share icon.
    A link will be generated, which you can copy and send to users who have access to the dashboard.
  6. View:

    To adjust how the dataset is displayed, click on the view icon and check or uncheck the “Fit to Window” option. This allows you to change the layout of the data to better suit your screen or viewing preference.
  7. Alerts:

    To keep track of important changes in your data, you can set up threshold alerts in your QuickSight dashboards using visuals like KPIs, Gauges, Tables, and Pivot Tables. These alerts let you define specific limits for your data, and you'll receive an email notification whenever those limits are crossed.

    For example, if you're a customer success manager and want to know when the number of support tickets goes above a certain level, you can create an alert on a visual that tracks ticket volume. Once the number exceeds your set threshold, QuickSight will notify you by email so you can act quickly.
    You can:
       • Create multiple alerts for the same visual
       • View and manage your alerts anytime in a QuickSight-supported browser
       • Keep your alerts active even if the visual is updated or deleted

    Note: Alerts are based on the filters applied at the time you create them. If filters change later, your existing alerts stay the same. To apply new filters, simply create a new alert.

Dataset Guide:

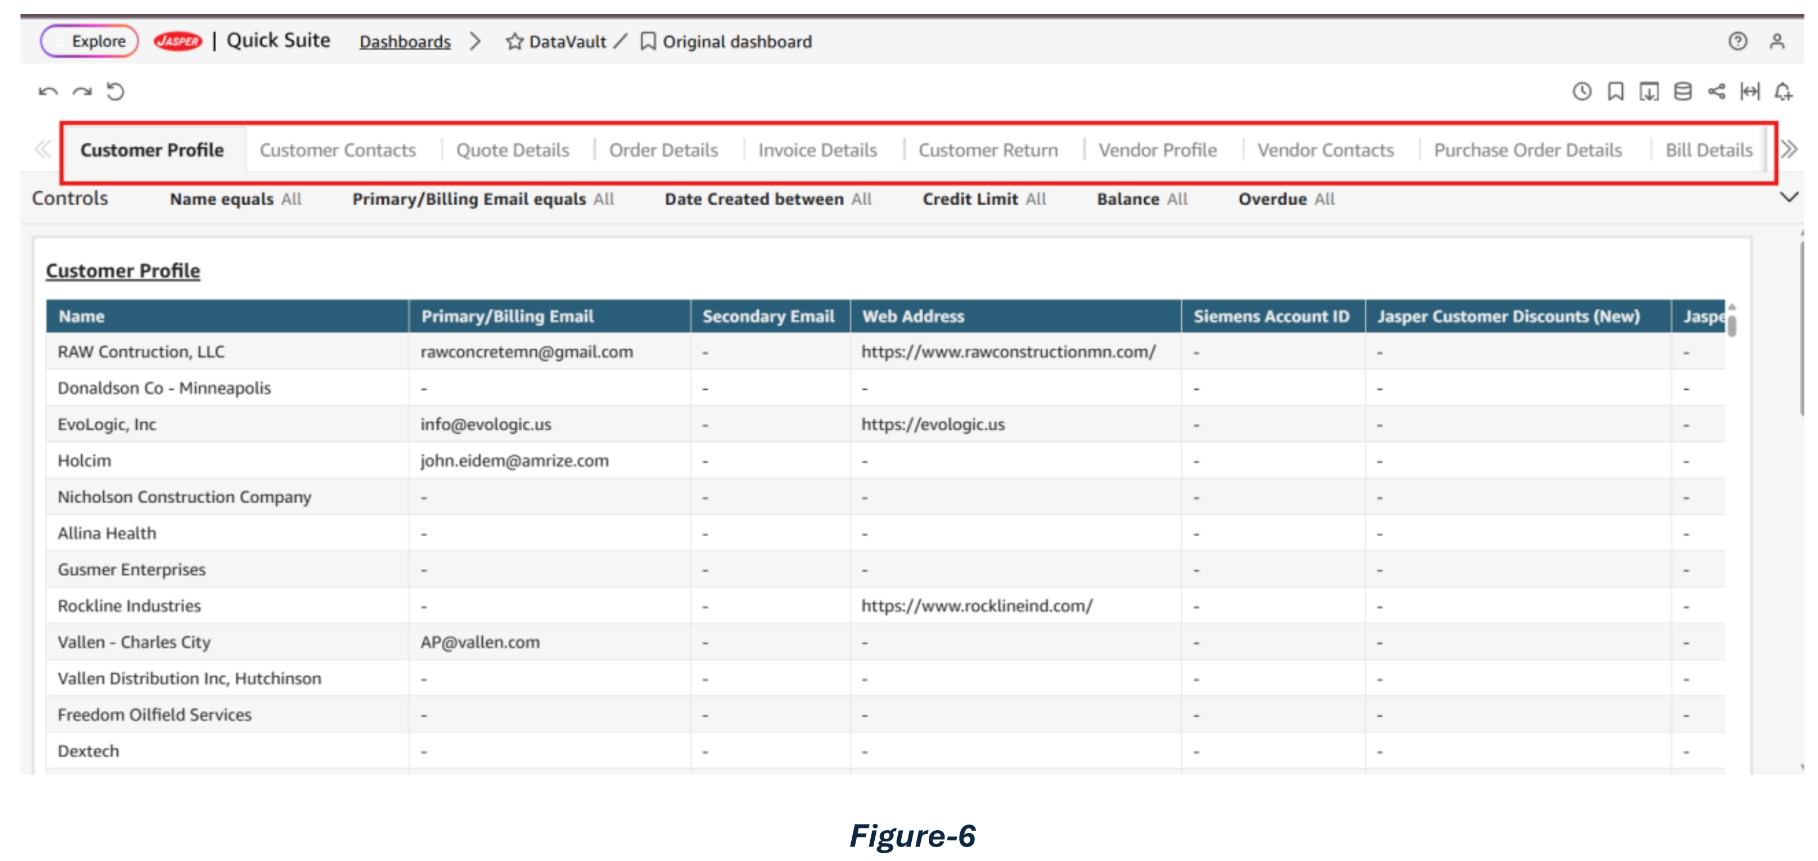
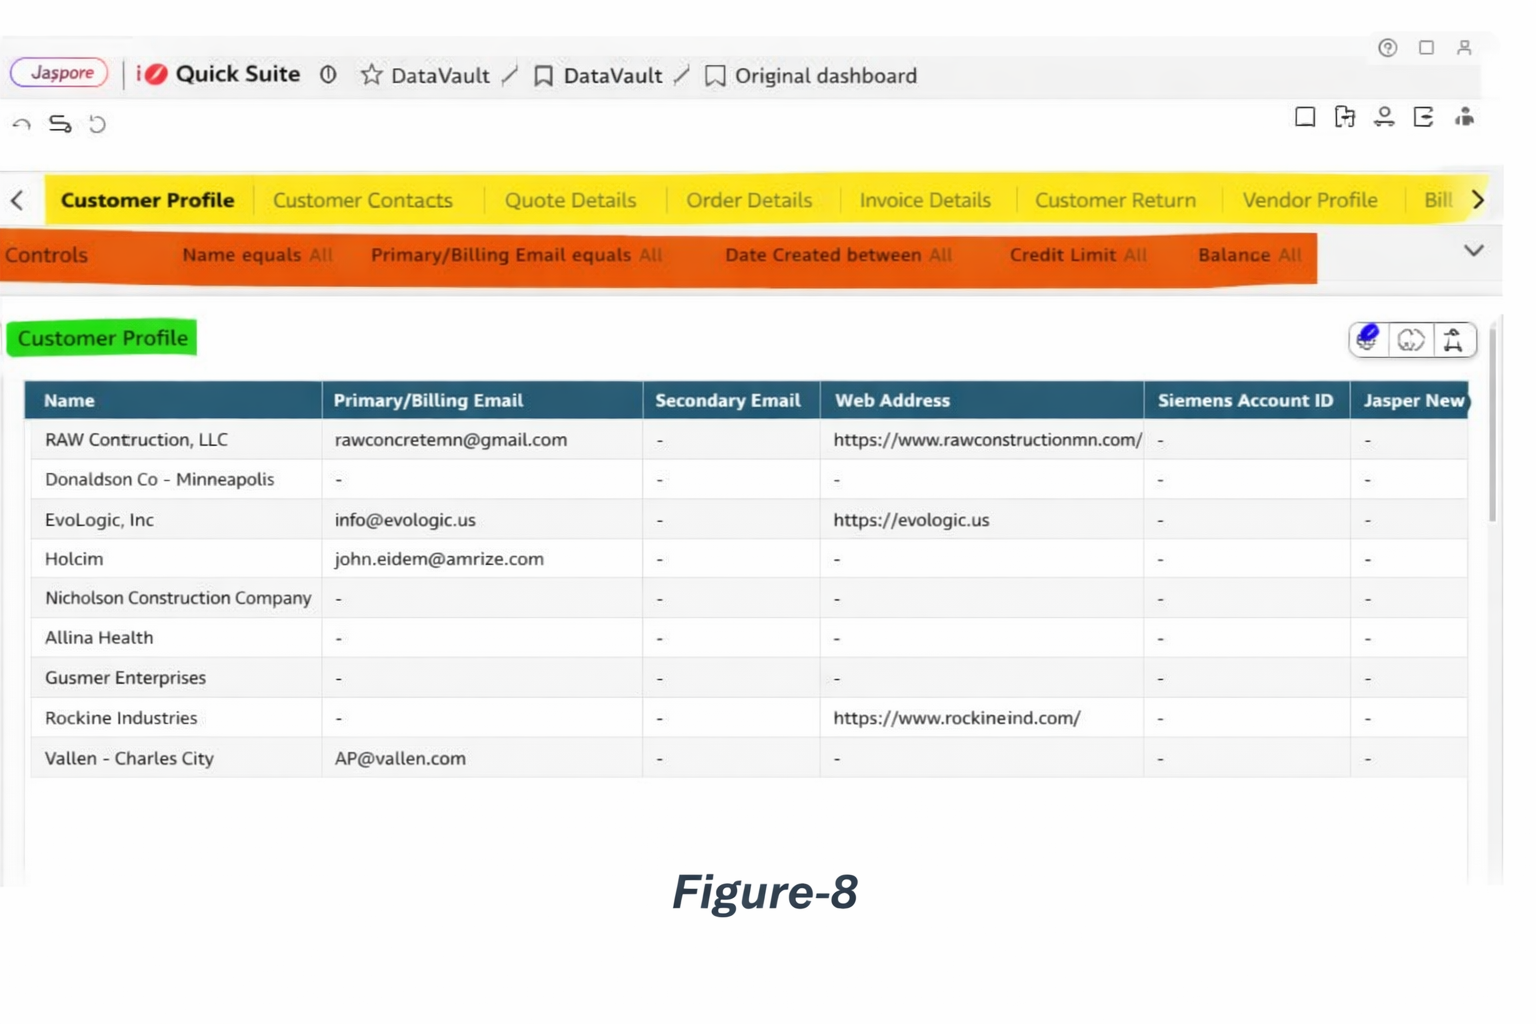
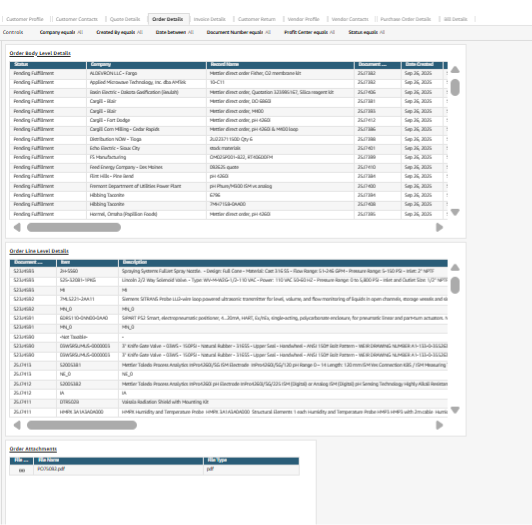
The page is divided into four main sections, as illustrated in (ref Figure 8):

  • Yellow Highlight – Represents the different record datasets available in the dashboard
  • Orange Highlight – Shows the filters that can be applied to refine the dataset view.
  • Green Highlight – Displays the results based on the selected record type and applied filters.
  • Blue Highlight – Indicates the section containing attached file data related to the all the records/selected records based on the applied filters.

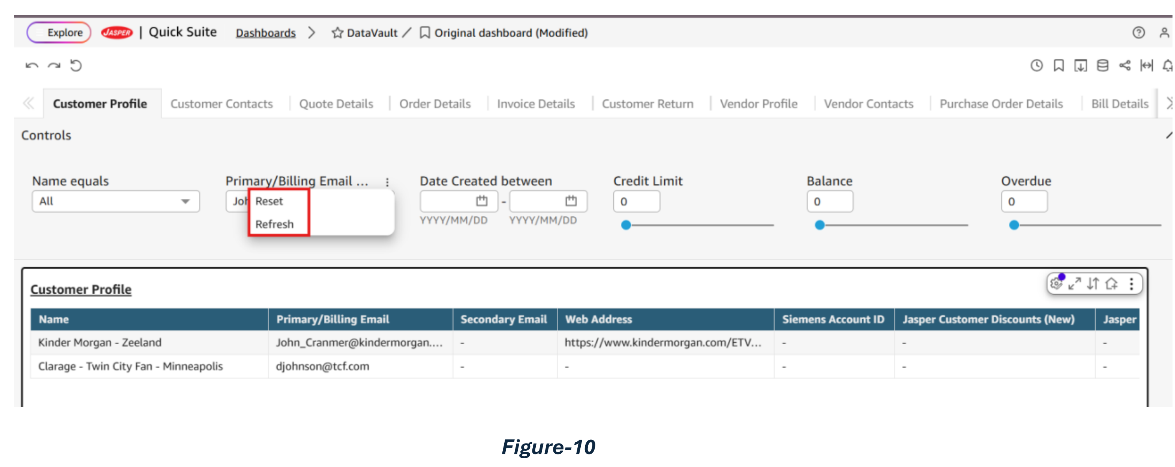
You can use the filters available in the Controls section to customize the data view based on your requirements. Once the filters are applied, the results will be automatically updated.

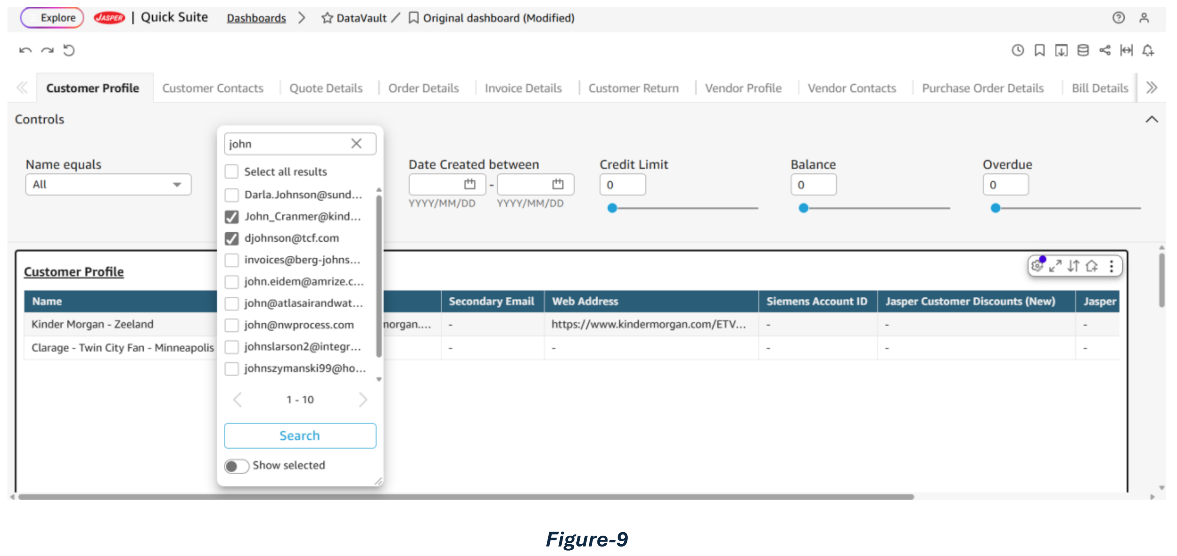
For example, as shown in the image (ref. Figure-9), to filter by email, you can enter the desired text in the filter field. The filter will then display a list of matching entries, which you can select to refine the results. Once selected, the filtered data will be automatically populated.

  • To refresh the data based on the applied filters, click on the three dots menu and select Refresh on each filter (ref. Figure-10)
  • To reset the data to its default state, click on the three dots menu and select Reseton each filter (ref. Figure-10)

Export Options:

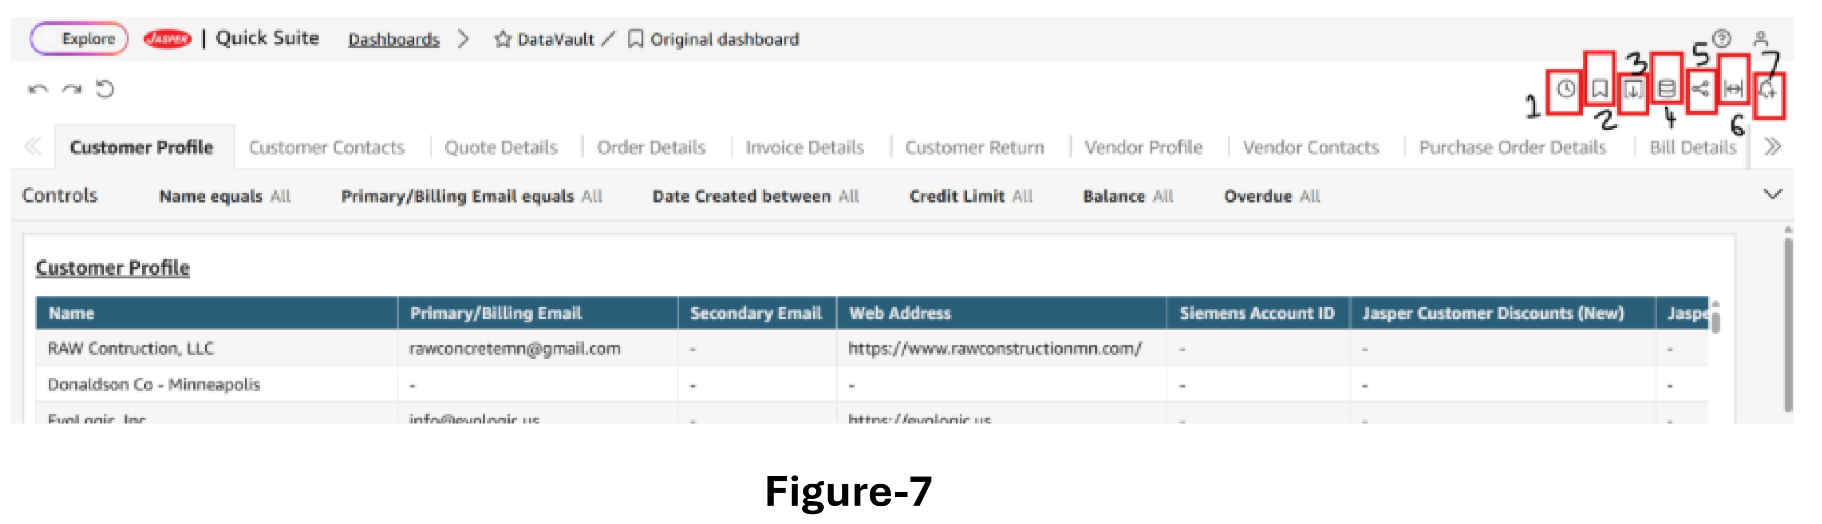
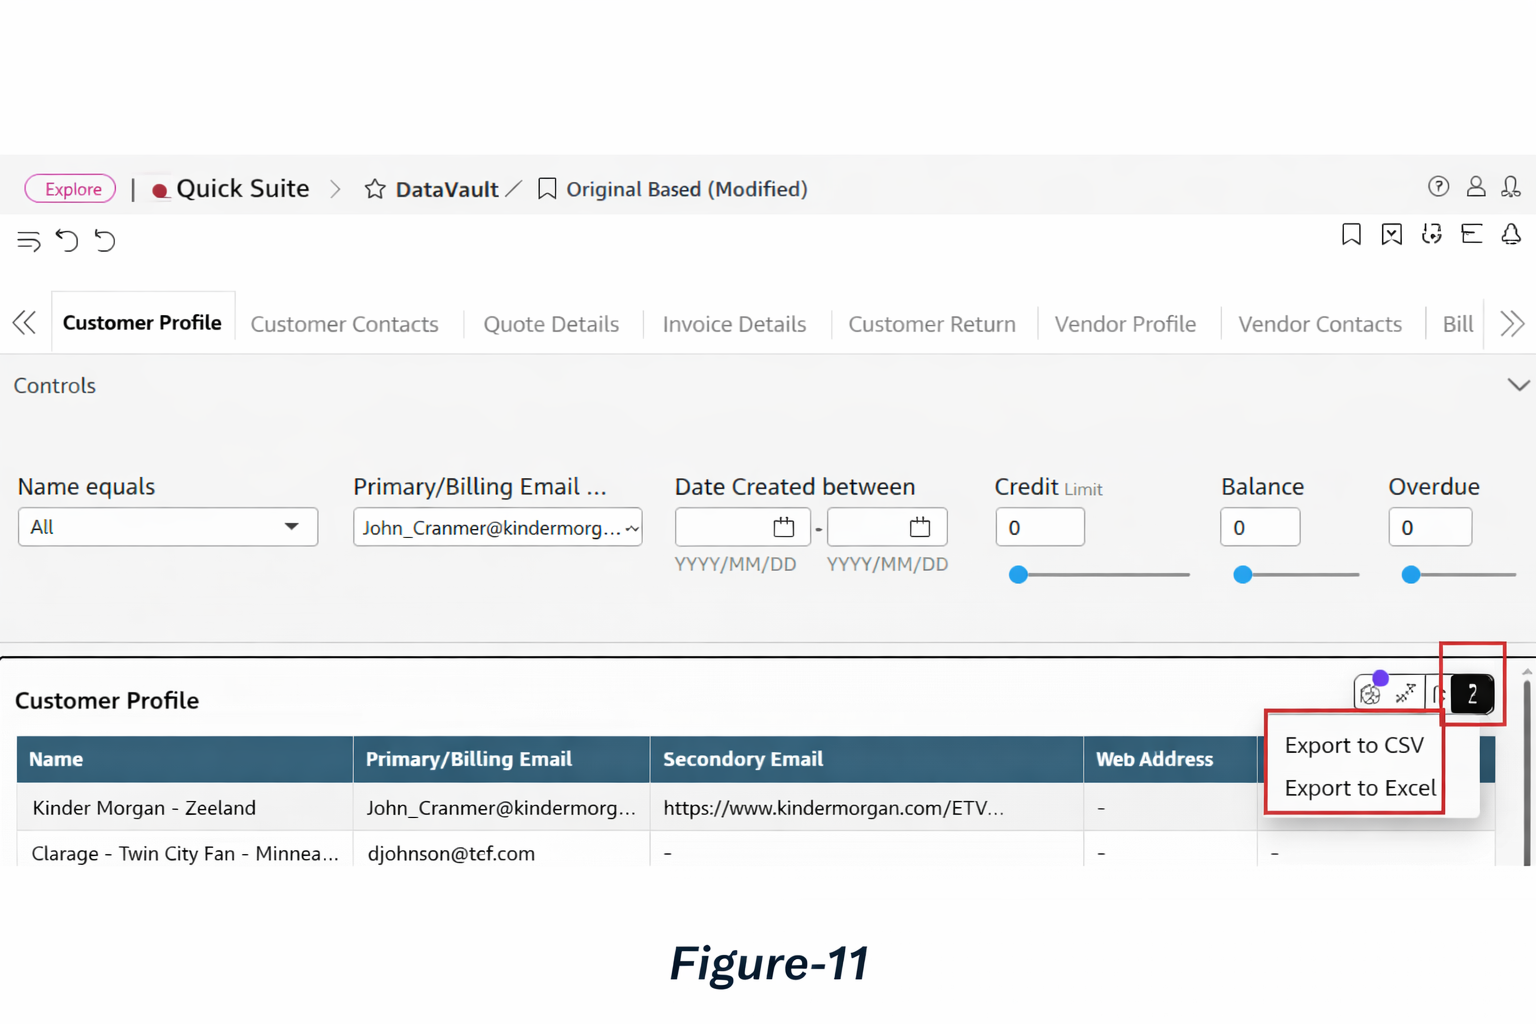
Under the Data section, click on the three dots menu to access the Export option. From there, you can export the data in either CSV or Excel format. (ref. Figure-11)

Related Records/ Attachments:

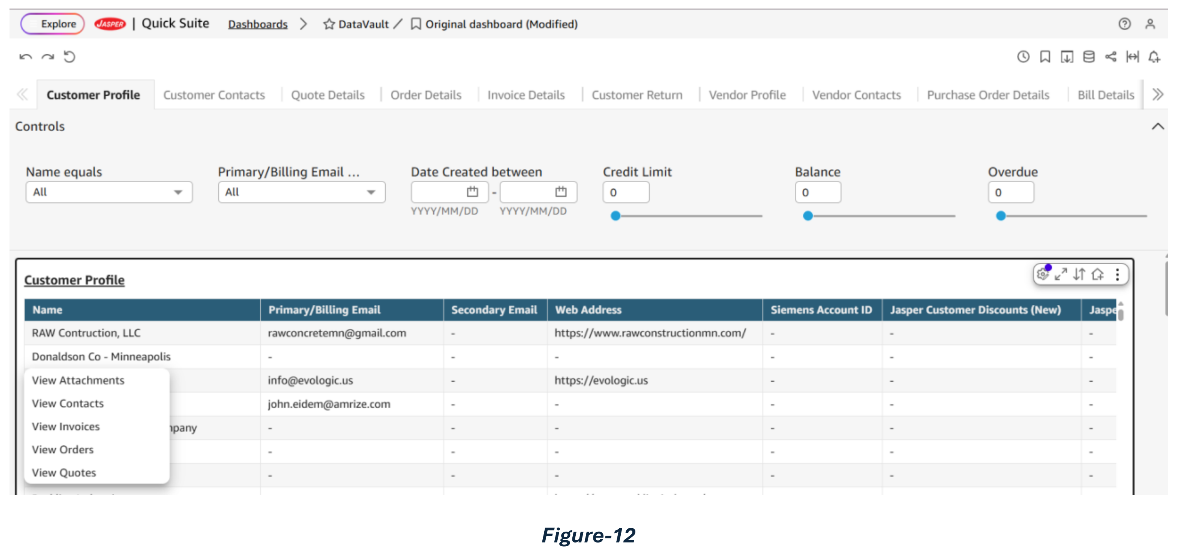
To view related records such as customers, transactions, linked to a customer in this screenshot, you can simply click on the relevant data (i.e. view customers, orders, Invoices etc.). This will display an option to View Related Records, allowing you to explore the associated details. (ref. Figure-12)

Figure-13

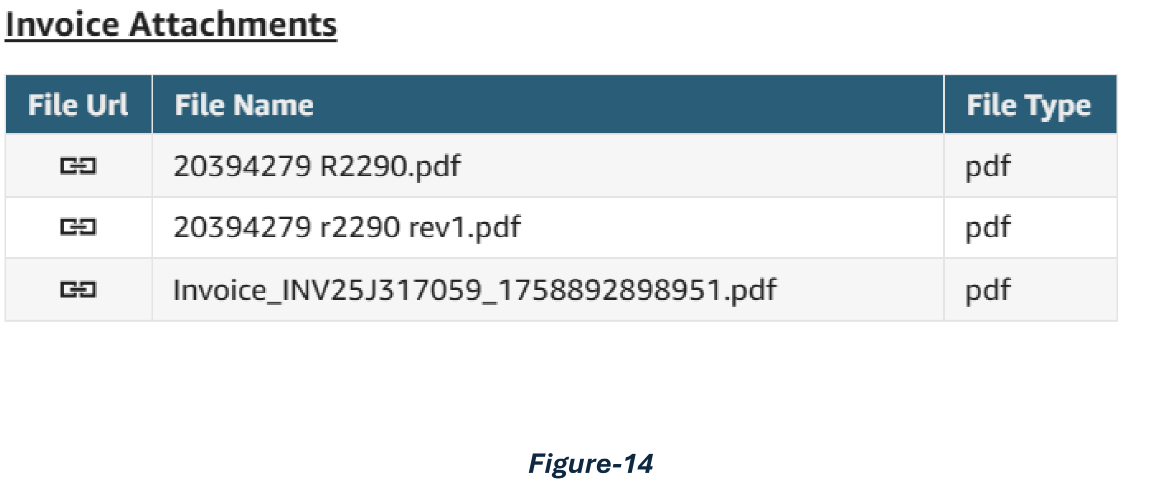
To view the attachment, click on the File link icon. It will open a new window with the related attachment. If it’s a PDF, you can download it/save it to your local system (ref. Figure-14)

To sort/ freeze columns:

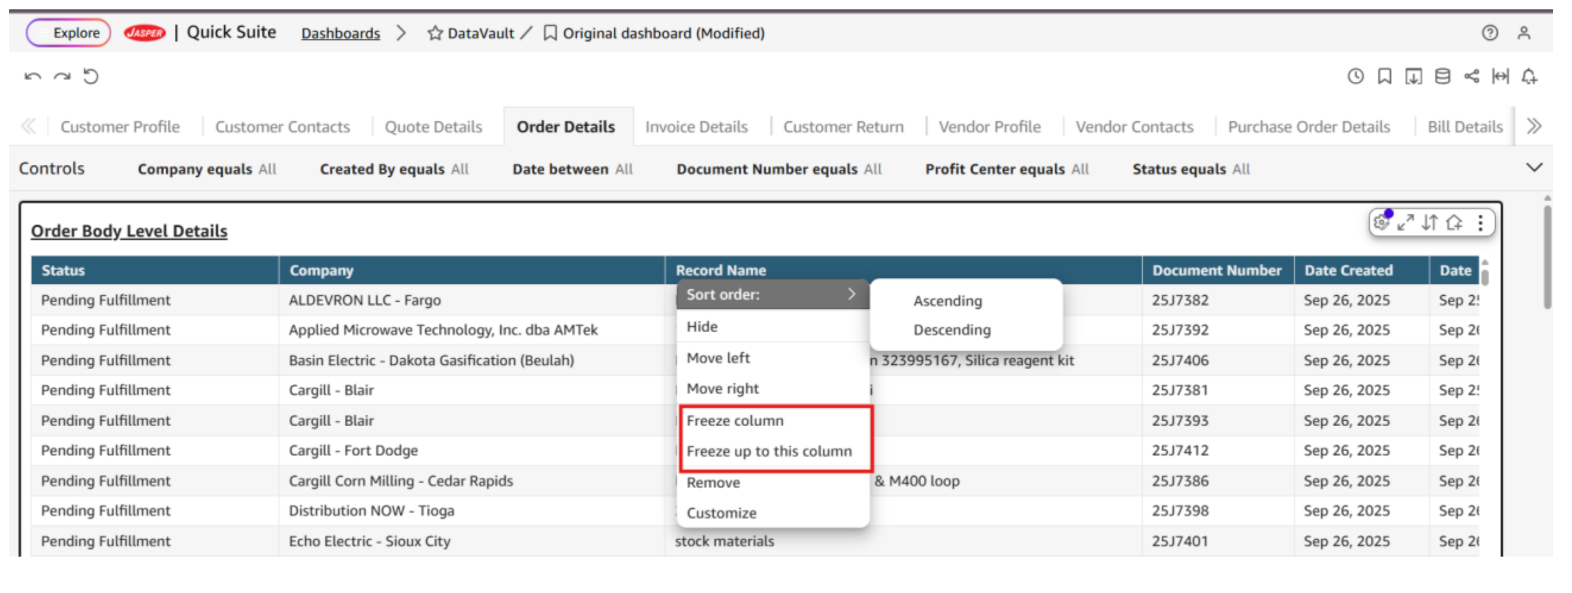
If you want to sort the data or columns in ascending or descending order, or freeze columns to compare specific data across rows, simply click on the column header. A menu will appear with relevant options, select the one that suits your needs. (ref. Figure-15)

Figure-15

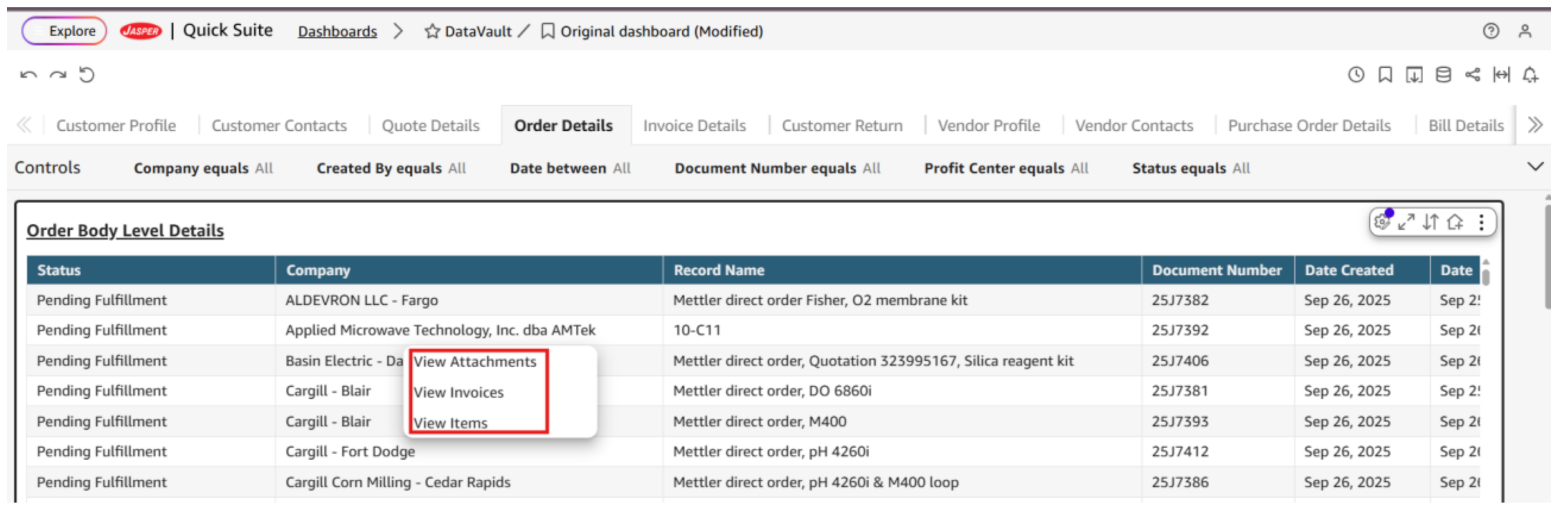
To view attachments related to a specific record, click on the corresponding order. You’ll see two options Attachments. Selecting either will instantly refresh the respective tables below and display the details associated with that record (ref. Figure-13)

Bulk Email Invoices - Tvarana
Find the Right SuiteApp
Thank you! Your submission has been received!
Oops! Something went wrong while submitting the form.